Kamis, 27 September 2007
Selasa, 11 September 2007
Scalping using Ergodic CCI indicators

I found this useful indicator from http://www.forex-tsd.com/
someone called fx sniper invent this indicator and using with another indicator make a system called "tlatomi". this system used in 4H time period.
i found that the ergodic CCI indicator quite useful for marking when to enter a market.
in the tlatomi system they use it the same.
put this indicator in 15m chart. you will see the indicator as seen on picture below.
the indicator will give strong signal after the line reach upper level 300, for selling signal, or after hitting below -300 for buying signal.
in tlatomi system they use it also at 4H chart to make sure entering the same trend. if at 4h chart show already reach -300, don't bother enter for sell/short. it is a buying signal for the next 4 hours. and see at 15m chart when the best time to enter.
now since i'm interested in scalping for 5 - 10 pips, here how i use it.
place the indicator at 5m and 15m chart.
use also sto 8,3,3 at both time chart (use it as usual as over bought or oversell signal)
selling signal is at the 15m chart. wait until the blue line crossing the red line heading down (it is best when the ergodic already reach 200 or 300). and the sto reaching level 50 after reached level 80 (heading down).
the best time to enter shown at 5m chart, when the line heading the same direction.
and i usually get the result after 30 - 60 minutes for 5 - 10 pips.
and the quit signal also shown at 5m chart. if the blue line crossing the red line heading up (in this sample) and the sto also give oversell signal. vice versa for the buying signal.
and it is more save to cross check it with other time frame, 30m, 1h, and 4h, to make sure we enter at the same trend. if 30m, 1h, and 4h, showing down trend and not yet or still far reaching -300 no need to againts it even the 15m and 5m chart show differently. (well sometime i do, thank goodnes it works )
it is quite save method.
i already try it with GU, EU, and UJ.
nice work with UJ since the price keep floating around.
and since sometime the green (dollar) give strong signal at the same time with these three pairs, it is nice to have them all at the same time. it will (hopefully) get 15 - 30 pips at the same time.
may the pips be with you ...
Easy or Stupid
I don't know with you guys ... after i choose NorthFinance as my broker, a simple calculation of what I will going through appears just like that.
minimum account permitted is $ 100,-. with 500:1 leverage, means we can trade 0,1 lot at any pairs. since I study the GU pairs, then i just trade in GU.
for every 1 pip that i get means i recieve $ 1,-.
let say I just scalping the entire day for 5 pips, once or twice. since only 5 pips, it should be very ... very ... very easy right ?
so every day, 5 days a week, 20 days a month you will have 100 - 200 pips. with no loss of course ! (its only 5 pips guys ... please deh ah!)
it means you can double your capital ($ 100,-) just in a month. and the math is like this :
1, 2, 4, 8, 16, 32, 64, 128, 256, 512, 1024, 2048, 4196, 8392 ... and so on until it reach $10.000,-
since if the capital use to trade is @10.000,- we can only get 200 : 1 leverage.
okay dude ... ring a bell ?
Is it so stupidly simple or what ?
hepi trading dude ....
Selasa, 07 Agustus 2007
COWABUNGA

Here is a very simple trading system ... so simple hard to believe.
i read about this while i study at babypips (http://www.babypips.com/), they try to using a simple indicators to give a trading system a chance ... here are what it takes;
EMA 5, EMA 10, RSI (9), Stochastic (8, 3, 3) and a MACD (12, 26, 9)
put all of this in 15 minutes chart.
and here is how it works:
buy signal,
EMA 5: wait until this line crossing EMA 10 from below
Stoch : wait until the stochastic reach the level 20 and wait until it reach level 50
RSI: wait until the line crossing level 50 from below it
MACD : use this only as a reversal trend or after "bearish" trend
sell signal, the other way around
EMA 5 : wait until the line crossing EMA 10 from above
Stoch : wait until the stochastic reach the level 80 and wait until it reach level 50
RSI: wait until the line crossing level 50 from above it
RSI: wait until the line crossing level 50 from above it
MACD : use this only as a reversal trend or after "bullish" trend
with this signal we can use it as an indicator when to enter market for a long period or short period trade ... depend on us ....
opinion:
i try to use this system for a week and a result is very provoking ... no loss for a 10 pips target, i try 4 times. and most of the time it only take 1 - 2 hours to get the result. since my maximum target at this time only 100 pips a month it surely does the work.
tips:
if you targeting for more then 20 pips at a time, there are more rules you need to obey, like busy trading time, etc. you can get that at babypips.
since the standard MACD from metatrader is quite hard to read, i change it with other indicator. i use the standar CCI indicator and CCI tweak indicator that i get from other system called "Tlotemi". they are very ... very ... very useful for me to get a trend signal.
and a gain ... it's so simple ... easy to follow ... easy to grip ...
just keep it simple guys .....
Senin, 06 Agustus 2007
10 pips a day ...
Here's the catch ....
with 1 lot ... you only need 10 pips to get US$ 100,-
with leverage 1 : 500 ... you only need US$ 200,- to get 1 lot
sounds easy isn't it ? ....(can you feel a pile of money in your head right now ? ...wkwkwkkwk)
.... think easy, feel easy, ... you get it easy .... "the secret"
with 1 lot ... you only need 10 pips to get US$ 100,-
with leverage 1 : 500 ... you only need US$ 200,- to get 1 lot
sounds easy isn't it ? ....(can you feel a pile of money in your head right now ? ...wkwkwkkwk)
.... think easy, feel easy, ... you get it easy .... "the secret"
Playing with MA

I would like to play with Moving Average and see what how useful this indicator in certain circumstances ... our goal is to get 10 - 20 pips and give other pairs to make an opportunity when the main or our favourite pairs are not "in the mood" time.
try put 5 indicator of the following; Simple MA(1 & 8) with blue lines, Exponential MA( 19 & 29 ) with red lines, and Simple MA( 50 ) with yellow line.
and open chart with 30M, 1H, and 4H time period put all the indicators in each chart.
the situation that we are going to take advantage is the following:
analyze every time "Simple 1" are going to cross "Simple 50"
it is so simple to get profit when this situation happens. but please notice, not when the market is "neutral". and do it only in 1H and 4 H period, in 30m charts oftenly not happening ... so better put this time chart out from this opportunities. about the profit target is up to you ... are you dare to try to get 20 pips ... or even 40 pips ? your choice....
analyze every time "Simple 1" crossing "Exponential 19"
Between Exponential 19 and 29 there is a gap, usually a wide one after the price take a long run up or down (this can be trace with the Simple 1). see what happen after Simple 1 crossing the Exponential 19. In often case the prize (if can't say the market) always try to hit the second red line (Exponential 29). We may fine that not always bull/bear candle fills in this gap, but there, usually, and attempt from market to reached over the second line. This oftenly happens even in 30 minutes period. with this, at least 10 pips you will find it easly to get (always cross your finger)
with this simple indicator and anlysis you may have another opinion where to put your pending order.... since you are not going to stare your chart 24 hours...
...for me with only 10 pips target, i can leave to do somthin else without worrying it so much. only anxious to see the result. and i can take 3 - 5 pending orders for a day, since usualy only 2 that will hit the price. never happen to me 3 of my pending target get the price, so i can give my margin to relax...
Finally, to make sure what is the trend or just to make sure you want to do it safely, always cross check with other time period before you decide to enter the market. example, if you want to enter the 1H period, check it with the 30M and 4H period. Is it the same pattern/trend or not ... always be wise (not greedy) and keep your mind neutral ... (that's what pipsology tought me)
"..there's always an oportunity whenever the market is still open ... its just a matter how you see it ... see right, think right, act right"
Hepi trading all....
Using MA on GBP / USD
 It is true (al least for me) that most pair has its own characteristic on how the market move, except on most JPY.
 Let us analyze this GU chart 4H periodic. Seeing the chart shown above, we might learn something interesting on how the market move. the case is like this: that chart is using MA indicator Simple MA 2 & 8 (blue), Exponential MA 19 & 27 (red), Simple MA 50 (yellow). I learn this while trying WSS (winning solution system) signal.

Whenever a trend is onthe move. we can notice a spread in red line. and the yellow kept its distance to the red and blue line. (usualy it indicate a long trend).
(1) Now let us see the blue line. it has a characteristic to bounce a while before it goes up again. at the chart shown above we can see the MA Simple 2 has 8 peak slowly reaching up way position.
(2) So, what we learn and use is, whenever we want to enter, in this case long position, we might want to consider where are the position right now. it may best when the Simple 2 & 8 are closing (and crossing finger Simple 2 while move away and not crossing it), since if we are entering the market while it (Simpel 2) already reach a peak and it will go down to Simple 8. (means you will have a pounding (dag...dig...dug) at your heart for 30 minutes - 4hours before Simple 2 make a new peak).
and another useful history in the chart above is, never enter when blue, red, and yellow line are going to meet each other for they are going to make a new plan where they are heading. coz, if you fail to predict ... you lose a lot ... eventhough if you gain you will gain big and fat ... ( hey, i thought that was what forex all about?!?) hope in this backtest we can learn something.


Here another sample in short position
Simple Indicator
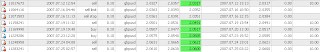
 Salah satu indicator untuk mengetahui apakah sedang trend atau tidak .... i have found it quiet interesting to see 3 - 6 chart of pair in the same time regarding to 1 common currency.
 example : (USD) ; G/U, E/U, A/U, U/J, U/CHF, U/CAD, or (JPY) ; G/J, E/J, U/J, AUD/J, or else like that it is very obvious and easy to see what is the current trend in driving. and for me it is explaining a lot wether fundamental news is affecting or not.
another example is like this : Before we decide to enter market, for instance EUR- JPY, and we analyze it will go for "long". we might want to take a look all the EUR pair, to make sure its currency are bulling. and take a look at all USD pair, to make sure it is bearing. if this is what happening at that moment ... it means you are 99,9 % clear to enter the market ... (0,1 % bad luck, crunchy lol).

sample on 6 pairs of JPY
also easy to decide what pair should we enter, because of the spread variety. example: when we think Yen is on a trend we have a choice between U/J, E/J, or G/J. and since the spread accordingly ; 3, 5, and 6 pips, perhaps we can choose U/J to enter the market for it's lowest spread with only a little difference in profit calculation. so ... what do you think ? but it is to bad we can only use metatrader platform to see many charts in one view.
--
Regards,
Arief Trianto
Langganan:
Postingan (Atom)

